
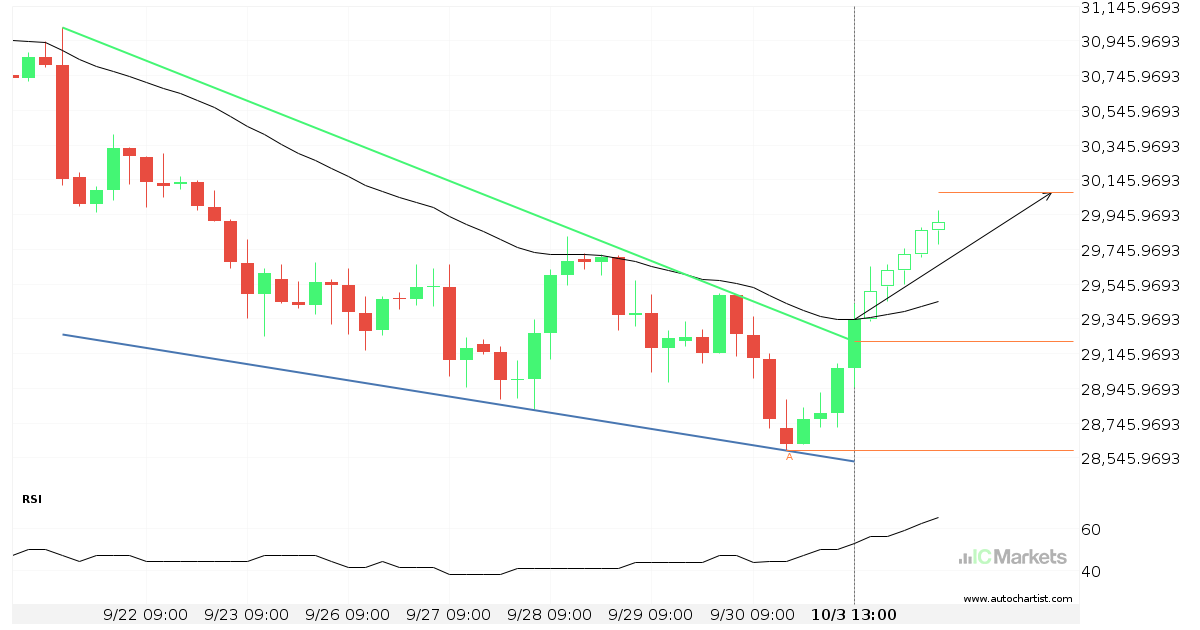
US Wall Street 30 Index has broken through resistance
US Wall Street 30 Index has broken through a resistance line. It has touched this line at least twice in the last 13 days. This breakout may indicate a potential move to 30073.8811 within the next 2 days. Because we have seen it retrace from this position in the past, one should wait for confirmation […]
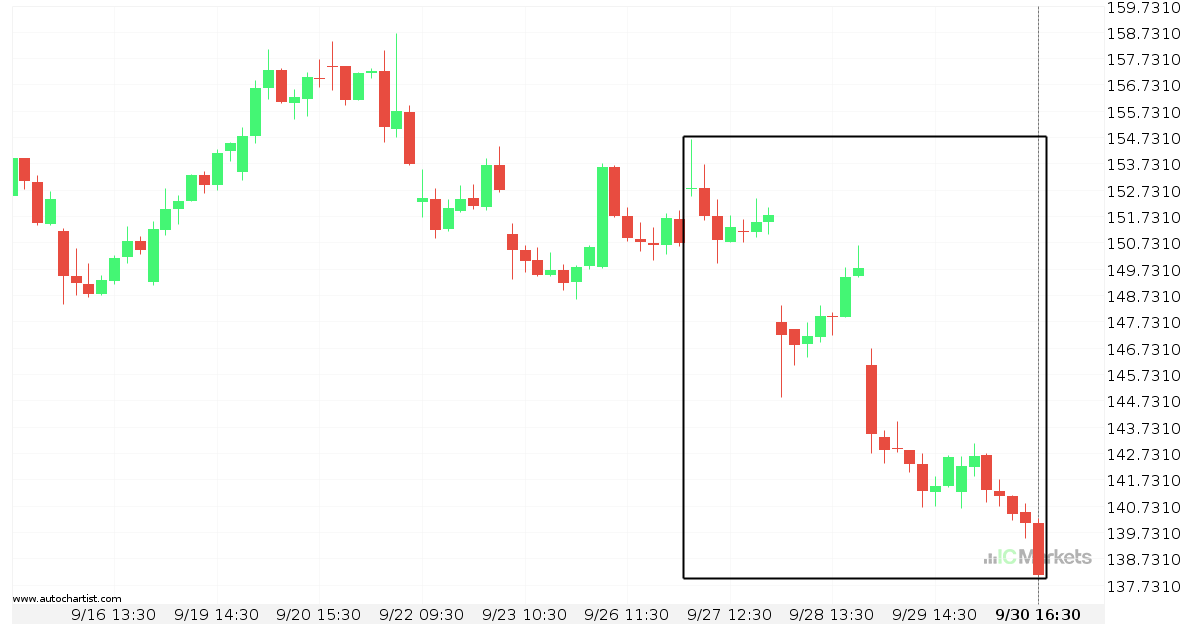
What’s going on with Apple Inc.?
Those of you that are trend followers are probably eagerly watching Apple Inc. to see if its latest 9.63% move continues. If not, the mean-reversion people out there will be delighted with this exceptionally large 4 days move.
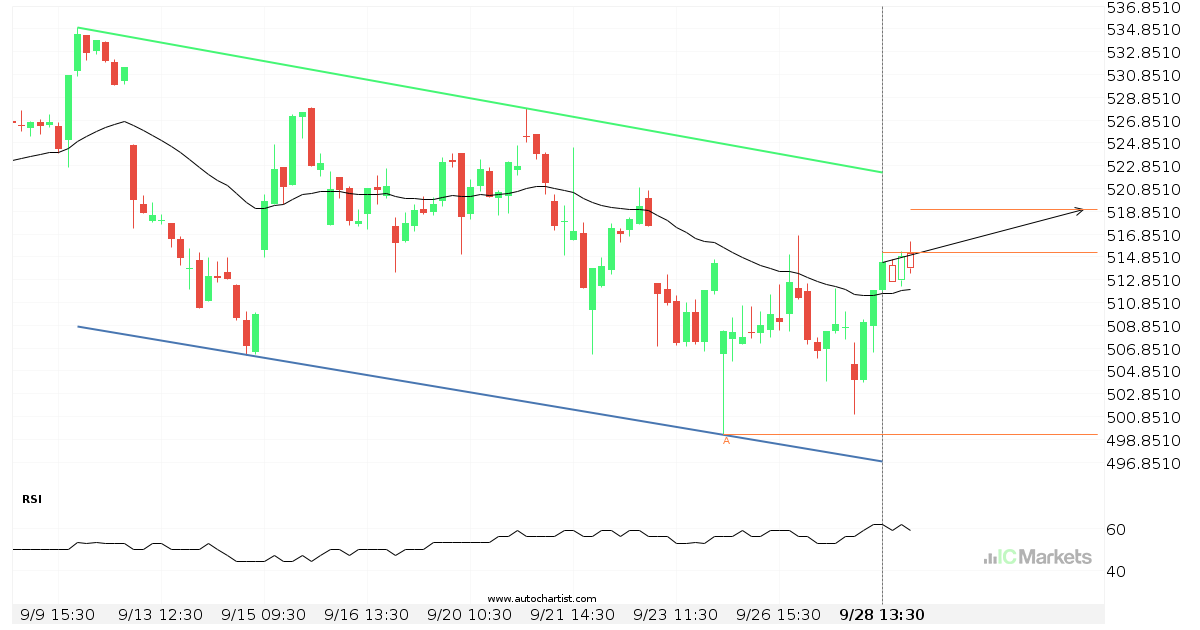
US Small Cap 2000 Index approaching support of a Channel Down
US Small Cap 2000 Index is approaching the support line of a Channel Down. It has touched this line numerous times in the last 14 days. If it tests this line again, it should do so in the next 3 days.
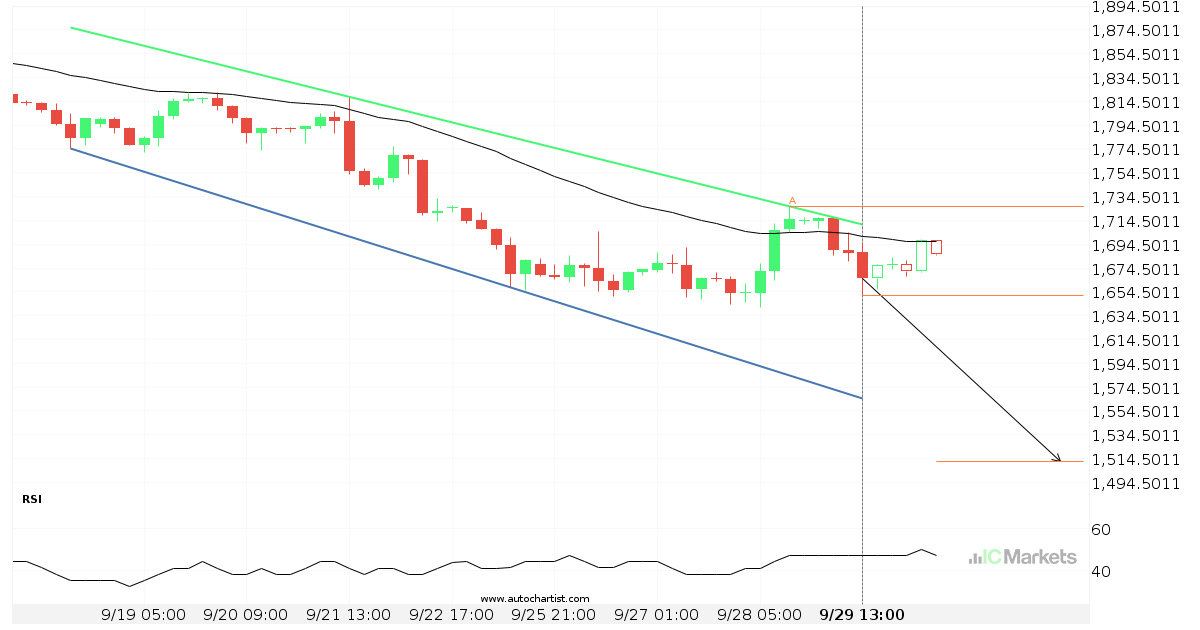
Unitedhealth Group Inc. approaching resistance of a Channel Down
Unitedhealth Group Inc. is approaching the resistance line of a Channel Down. It has touched this line numerous times in the last 17 days. If it tests this line again, it should do so in the next 2 days.
Meta Platforms, Inc. – Class A Common Stock approaching resistance of a Channel Down
Meta Platforms, Inc. – Class A Common Stock is approaching the resistance line of a Channel Down. It has touched this line numerous times in the last 6 days. If it tests this line again, it should do so in the next 7 hours.

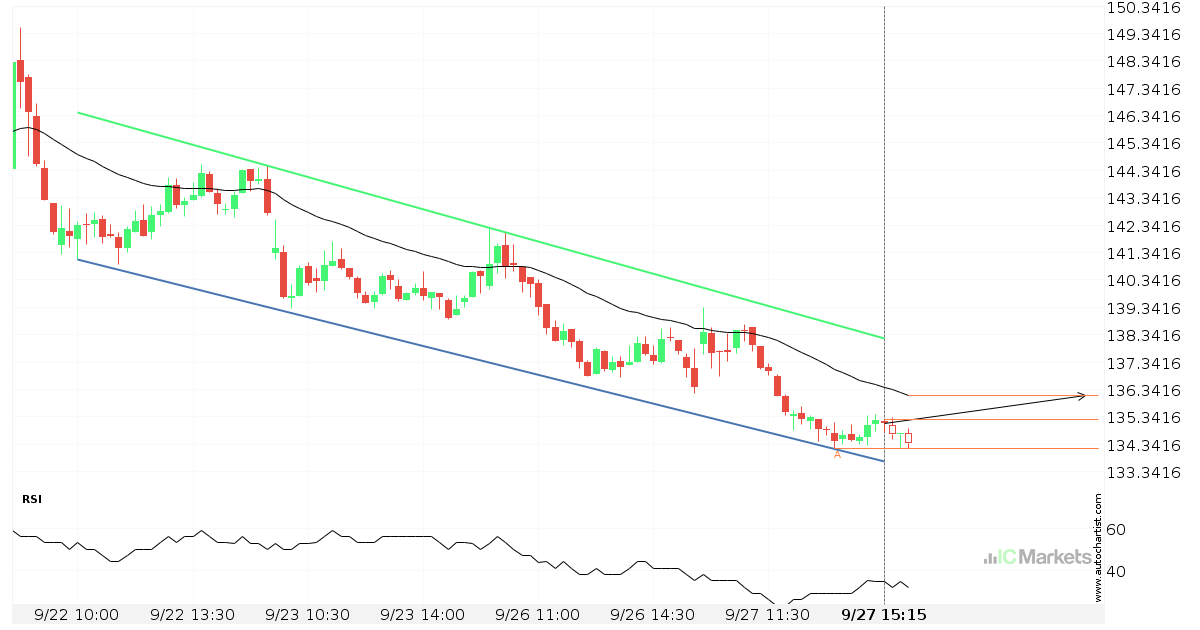
Will Microsoft Corporation have enough momentum to break support?
Microsoft Corporation is heading towards the support line of a Falling Wedge and could reach this point within the next 6 hours. It has tested this line numerous times in the past, and this time could be no different from the past, ending in a rebound instead of a breakout. If the breakout doesn’t happen, […]
Will US Small Cap 2000 Index have enough momentum to break support?
US Small Cap 2000 Index is heading towards the support line of a Channel Down and could reach this point within the next 2 days. It has tested this line numerous times in the past, and this time could be no different from the past, ending in a rebound instead of a breakout. If the […]
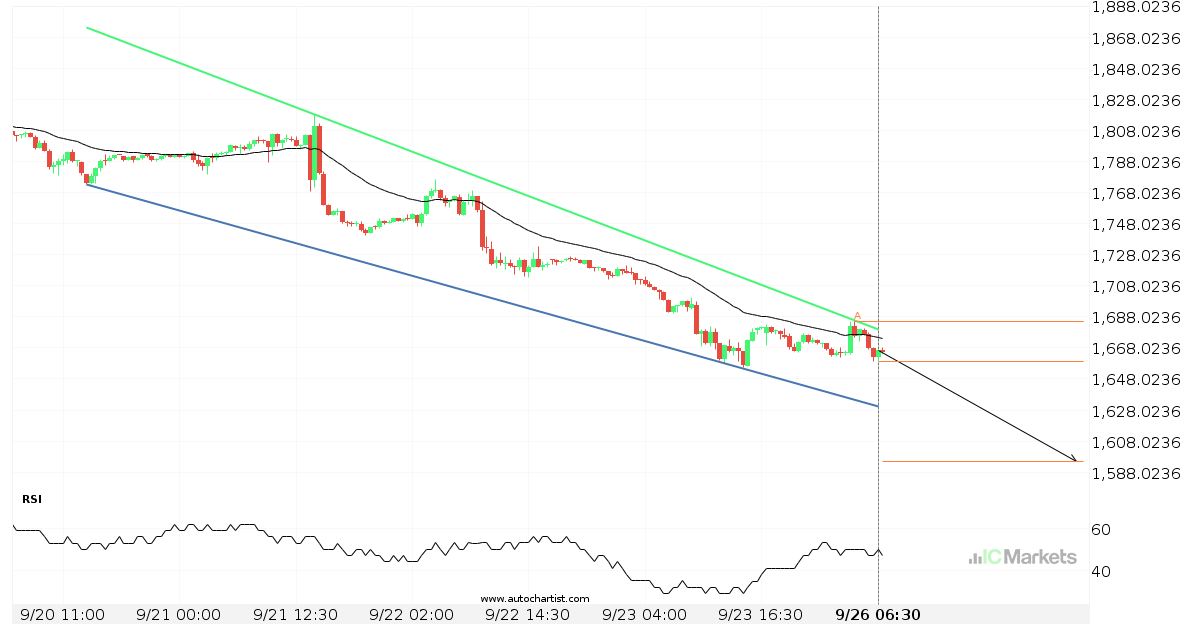
US Tech 100 Index approaching support of a Falling Wedge
US Tech 100 Index is approaching the support line of a Falling Wedge. It has touched this line numerous times in the last 3 days. If it tests this line again, it should do so in the next 16 hours.
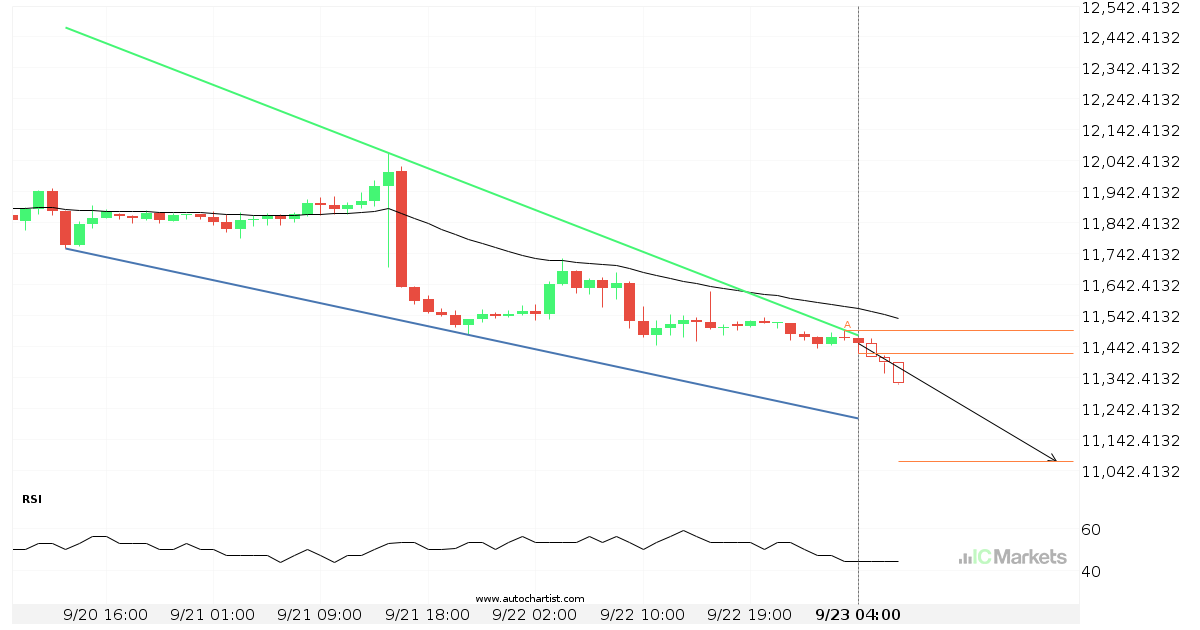
US Tech 100 Index approaching support of a Falling Wedge
US Tech 100 Index is approaching the support line of a Falling Wedge. It has touched this line numerous times in the last 2 days. If it tests this line again, it should do so in the next 7 hours.
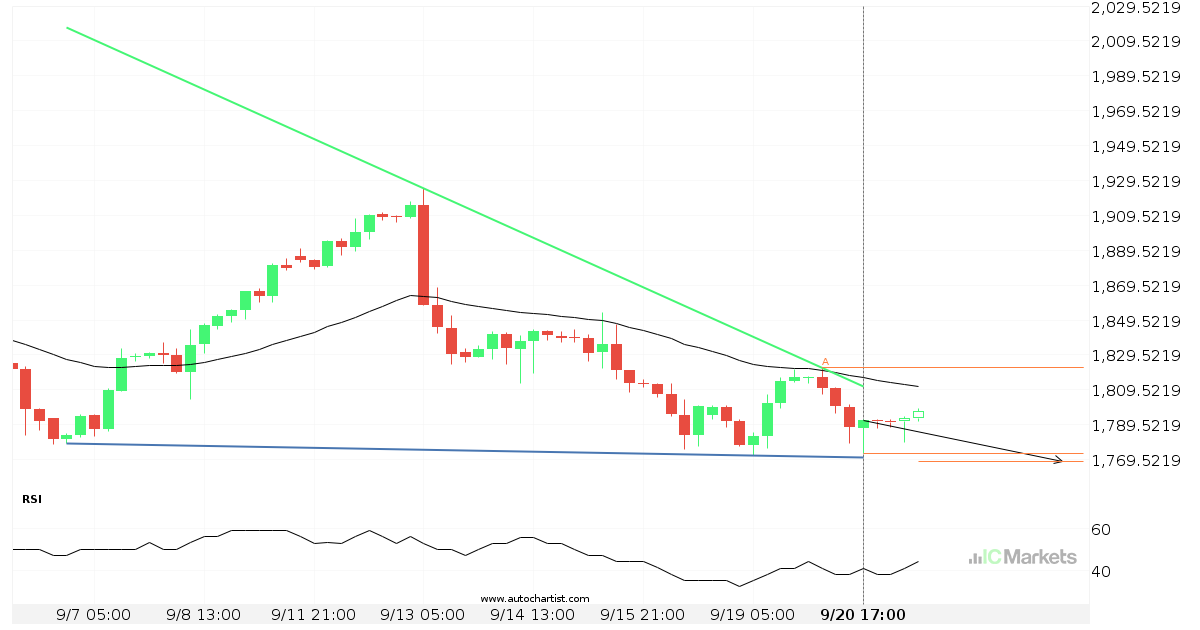
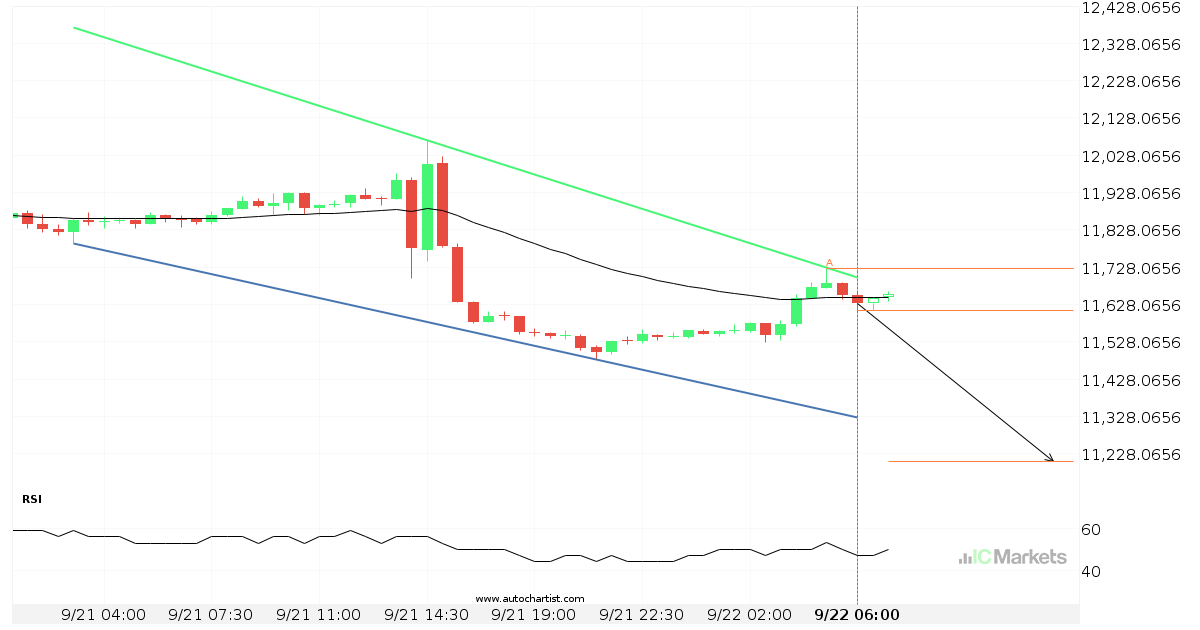
Will US Small Cap 2000 Index have enough momentum to break support?
US Small Cap 2000 Index is heading towards the support line of a Descending Triangle and could reach this point within the next 3 days. It has tested this line numerous times in the past, and this time could be no different from the past, ending in a rebound instead of a breakout. If the […]